


0
US Dollar Index
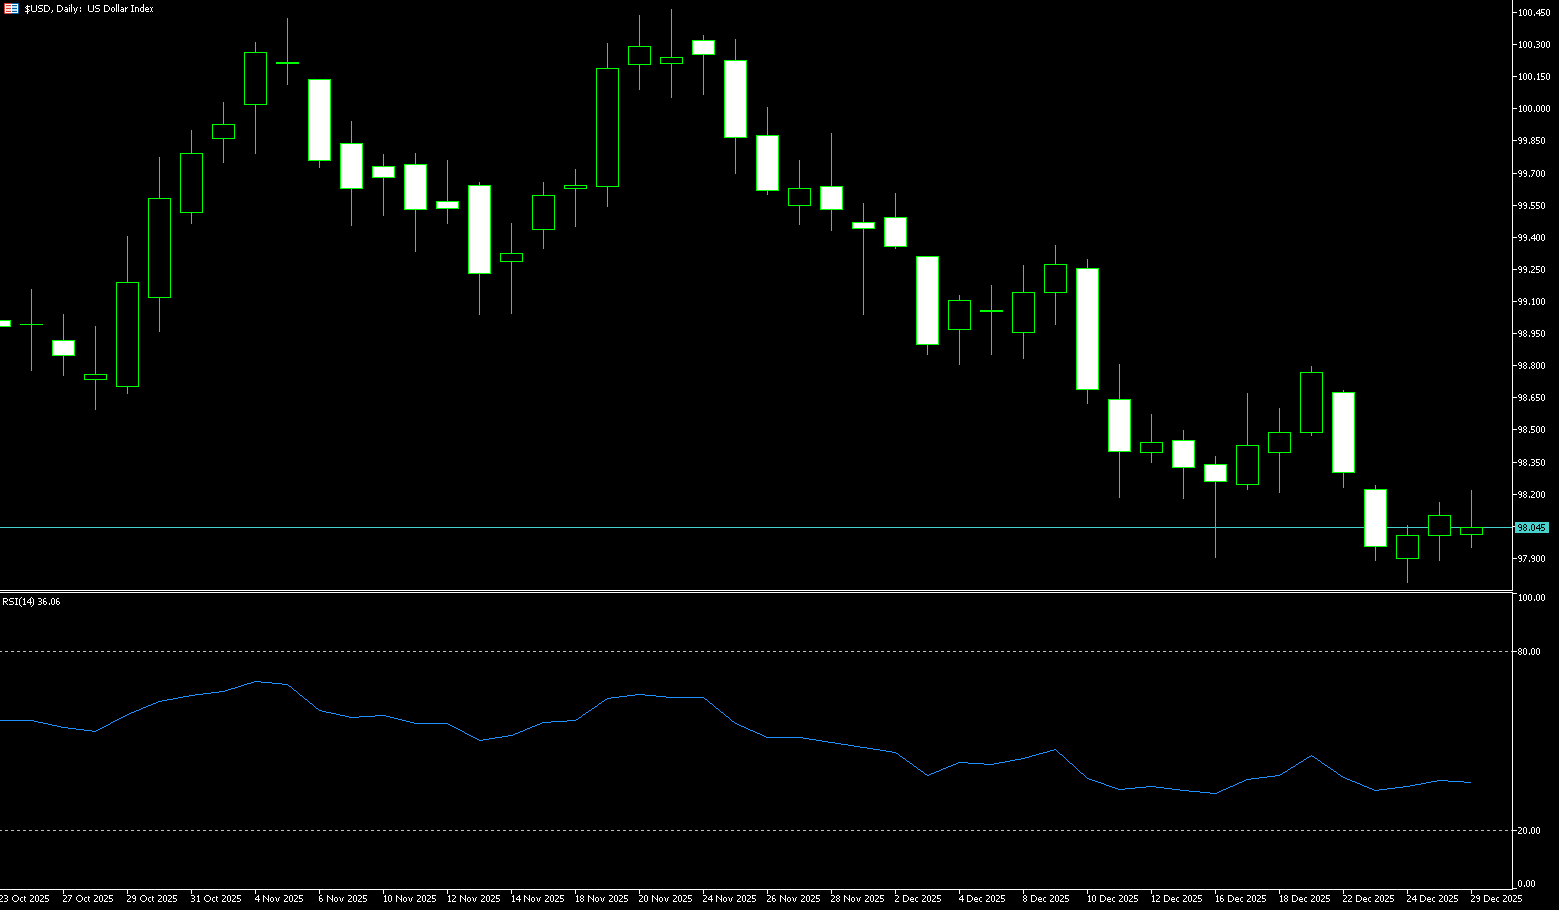
In global markets, the US dollar continues to be under pressure after a significant weakening throughout the year. Although it stabilized around 98.00 last Friday, it remains in the low range since early October, with a cumulative decline of 9.7% this year, heading towards its worst annual performance since 2017. The core driver of this weakness is the strengthening market expectation that the Federal Reserve will continue its rate-cutting cycle—this expectation directly suppresses US Treasury yields. The dollar has weakened overall this year as investors expect further rate cuts by the Fed, while other major central banks are likely to maintain stable interest rates. This has led to a continuous narrowing of the dollar's premium over other major currencies, becoming the main logic behind the dollar index's decline. However, why does good data strengthen the Fed's rate-cutting expectations, and why has recent poor data caused the dollar to rebound?
Currently, a series of factors point to a downward trend in the dollar, but the foreign exchange market is very discerning. Funds will pre-emptively bet on almost all negative factors. Therefore, the dollar has not reached new highs recently despite the escalating negative news, and is even brewing a rebound. It can be observed that while gold, silver, and copper rose rapidly to new highs, the US dollar did not fall. This suggests that the dollar may be consolidating before any new negative news emerges, indicating that the negative factors have likely been fully priced in. The daily chart of the US dollar index shows that after breaking through the bottom, the dollar attempted a rebound to form a reversal pattern, but this pattern was interrupted by cross-currency selling, and the pattern has not yet been successfully formed. If it cannot quickly recover the 98 level (today's high) in the near term, the dollar may continue to decline, with support levels at 97.50 and 97.00 (psychological levels). If the dollar rebounds, resistance levels are at the lower edge of the trading range at 98.58 (the 100-day moving average) and near 98.75 (last week's high).
Today, consider shorting the US Dollar Index around 98.15; Stop loss: 98.25; Target: 97.65; 97.70
WTI Crude Oil
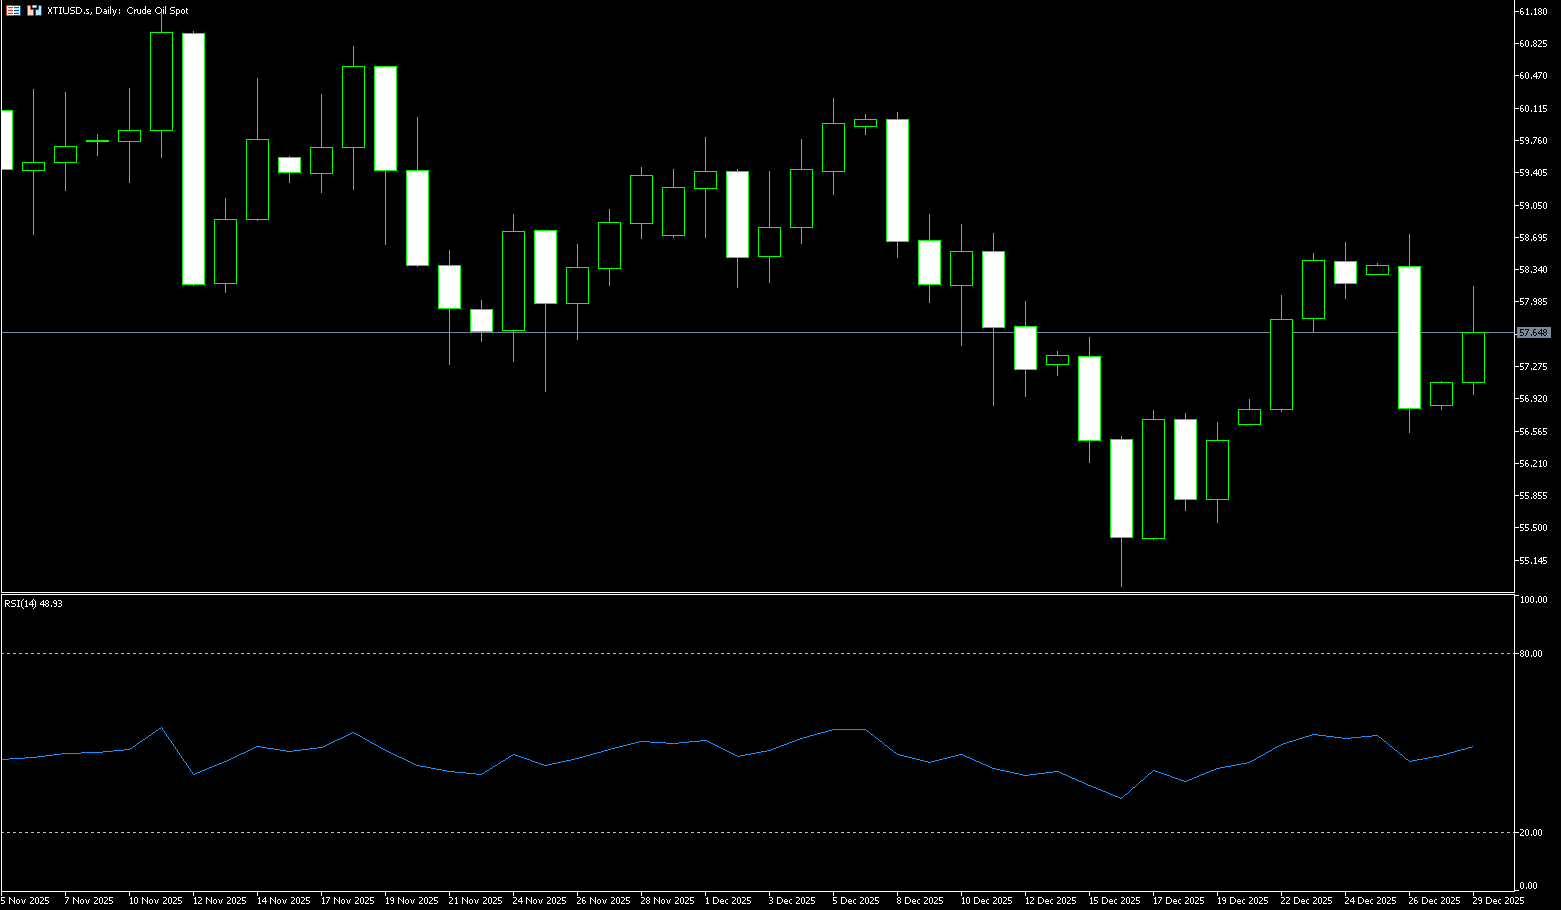
US crude oil is trading around $57.70 per barrel. The market is focused on the progress of the Russia-Ukraine negotiations. Trump and Zelensky failed to reach an agreement on territorial issues, but security talks are nearing completion. Although recent geopolitical disruptions have provided some support for oil prices, allowing them to rebound from near five-year lows reached in mid-December, oil prices are still poised to record their biggest annual decline since 2020 in 2025. Year-to-date, Brent and US crude oil have fallen by 19% and 21% respectively, with market concerns that the oversupply situation, mainly caused by increased crude oil production, will continue into next year. Geopolitical risk premiums have supported recent prices but have not substantially changed the fundamental narrative of oversupply. The International Energy Agency (IEA) predicted in its December report that global oil supply will exceed demand by 3.84 million barrels per day in 2026. Meanwhile, the market is closely watching the Russia-Ukraine peace process, as a potential peace agreement could lead to the lifting of international sanctions on the Russian oil industry, thus impacting the global supply landscape.
Looking at the daily chart, WTI crude oil previously declined from a high of $60.25 in early December, repeatedly rebounding to the $58.50-$58.80 area before encountering resistance, indicating that the selling pressure above remains clear. During the decline, it touched a low of $54.88 before a rapid rebound, forming a V-shaped pattern of "sharp drop-sharp rebound." However, the current price has clearly entered a consolidation phase after returning to the psychological level of $60.00, indicating that the bulls have not gained sustained momentum. Structurally, $58.50-$58.80 is the most critical static resistance line: it coincides with the upper edge of the previous densely traded area and also the resistance level after the pullback. Secondly, the $60.00 psychological level... And $60.25 {December high}. Below, $55.72 {December 18 low} forms a key short-term support level. Once broken, the price will likely head towards $54.88, the near 9-month low, which represents the "last line of defense" for bearish market sentiment.
Today, consider going long on crude oil around $57.58; Stop loss: $57.40; Target: $58.80; 59.00
Spot Gold
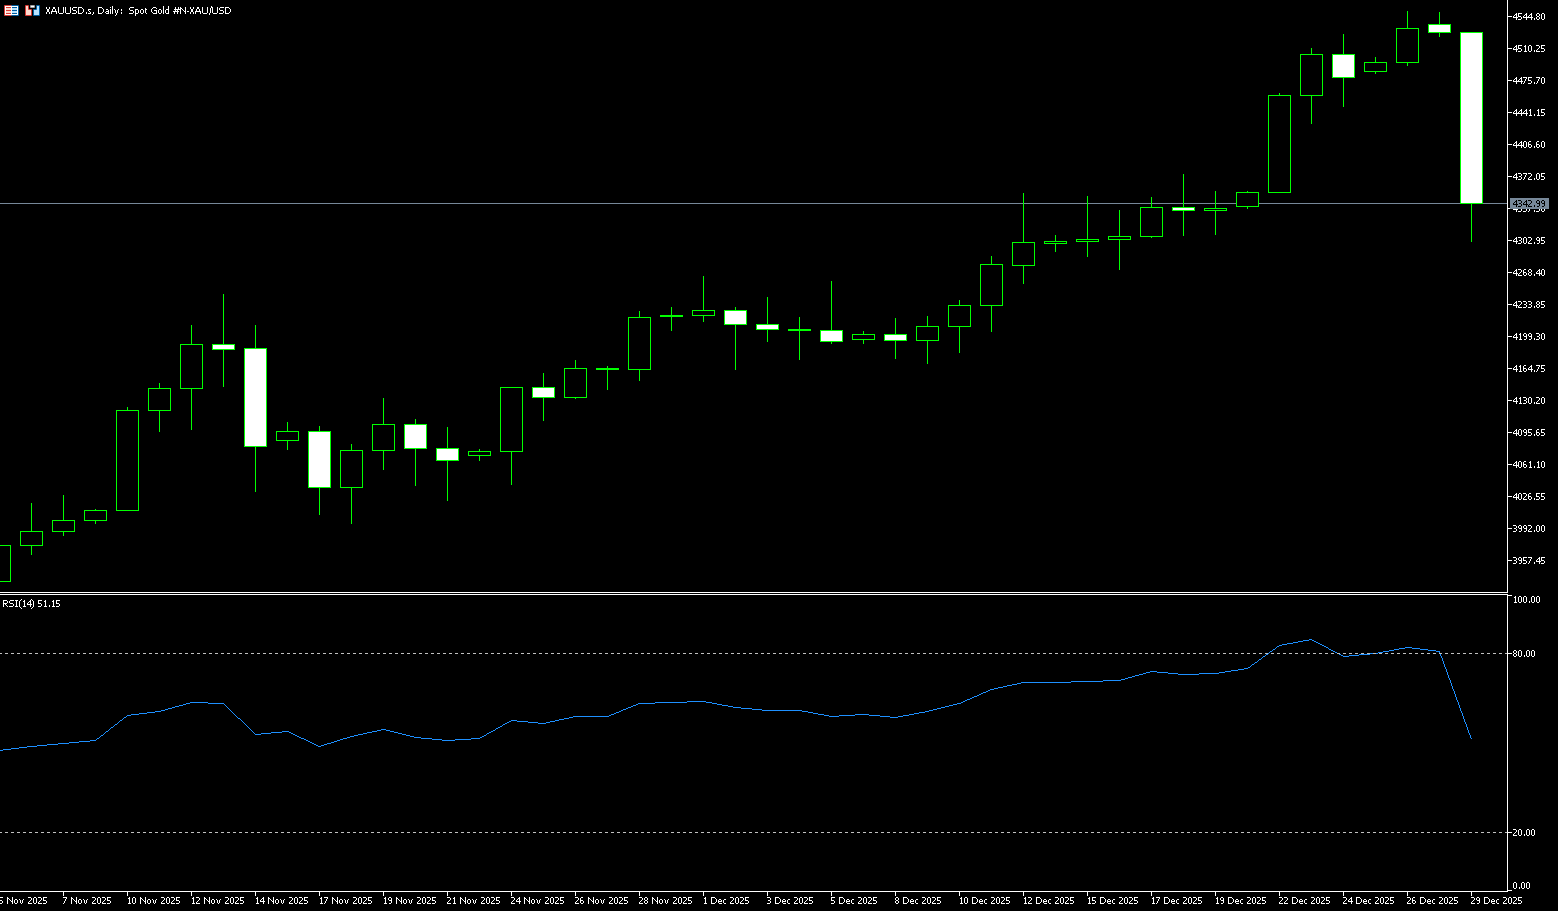
Gold fell more than 4% on Monday, dropping below $4,310 an ounce, as investors locked in profits after record highs. Despite initial progress in US-Ukraine peace talks, key uncertainties remained, putting pressure on safe-haven demand. President Trump stated that significant progress had been made in negotiations with Ukrainian President Zelensky, although a final agreement could still take weeks. Zelensky indicated that the framework was largely in place and US security guarantees for Ukraine had been finalized, but top-level issues, such as control of the Donbas region, remained unresolved. Meanwhile, ongoing tensions in the Middle East and escalating friction between the US and Venezuela continued to support gold's defensive appeal. Despite the metal price... Gold prices have retreated significantly, but are still up over 70% this year, on track for their strongest annual gain since 1979, supported by continued central bank purchases, sustained ETF inflows, and expectations of further interest rate cuts next year.
From a technical perspective, gold prices have not yet shown bearish signs. The 4-hour chart shows the 20-period simple moving average turning downwards above current levels, providing resistance around 3,382.50. Meanwhile, the pair remains above the 100-period and 200-period simple moving averages; in fact, buyers appear to be defending the short-term simple moving average below 4,330.81. At the same time, technical indicators are approaching oversold territory and are currently trending towards a rebound, but this is not yet sufficient to confirm a short-term rally. On the daily chart, Gold rebounded after testing a bullish 20-day simple moving average (SMA), which is above the 100-day and 200-day SMAs. The longer-term SMAs maintain a solid upward slope, all suggesting that buyers remain in control. The 20-day SMA at 4,309.32 provides dynamic support nearby, while the 100-day SMA is located at 3,924.00. A break below this level could expose the 4,232 (34-day SMA) and 4,200 levels.
Consider going long on spot gold today near 4,330; Stop loss: 4,325; Target: 4,360. 4,370
AUD/USD
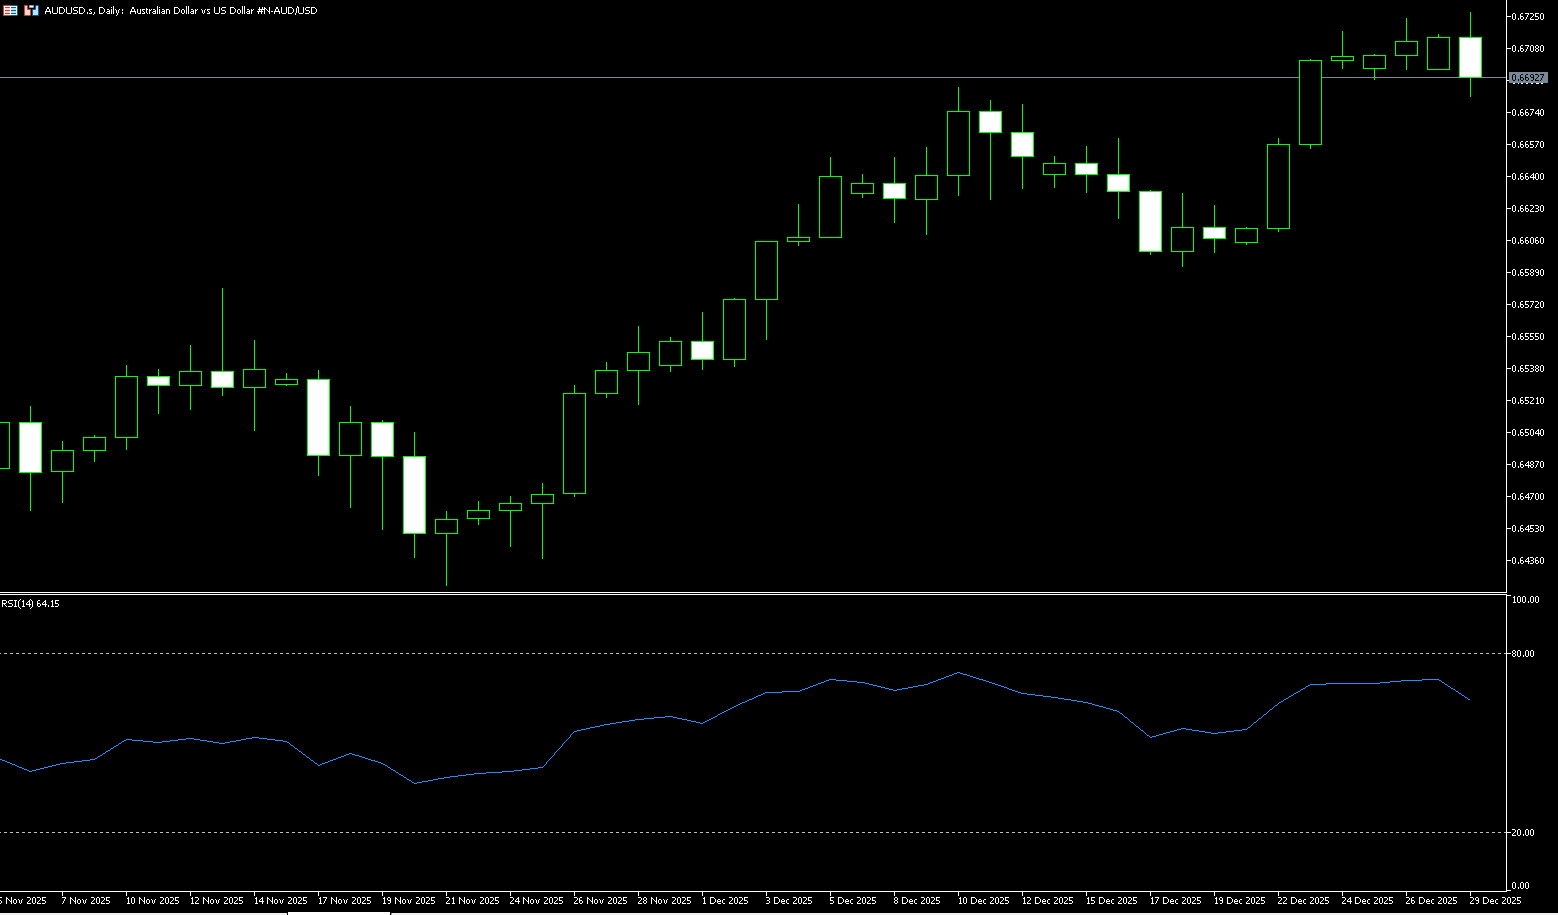
The Australian dollar rose against the US dollar on Monday, briefly holding above a 14-month high of 0.6724, a level reached on December 26. The pair subsequently retreated below 0.6700. The AUD/USD strengthened as market expectations for a Reserve Bank of Australia (RBA) rate hike increased. The RBA's December meeting minutes revealed weakened confidence among board members that monetary policy remained sufficiently tight. The minutes also indicated that the board was prepared to tighten policy if inflation failed to ease as expected, focusing on the upcoming fourth-quarter CPI report on January 28. Stronger-than-expected core inflation data for the fourth quarter could prompt the RBA to raise rates at its February 3 meeting. China's Ministry of Finance plans to expand targeted investment in priority areas, including advanced manufacturing, technological innovation, and human capital development. Given Australia's close trade relationship with China, any impact on the Chinese economy could affect the Australian dollar.
The AUD/USD pair surged above 0.6700 last Wednesday. See 0.6724, a near 15-month high. The pair remains above the rising 9-day simple moving average at 0.6660, maintaining its short-term uptrend and favoring the formation of higher lows. The 14-day Relative Strength Index (RSI) on the daily chart is 69.00 (close to overbought levels). The RSI has not yet entered overbought territory and still has room to rise before reaching 70. Positive momentum is confirmed. A close above the 0.6700-0.6724 area would open the door to further gains, targeting the October 7 high of 0.6810. Support lies within the range of 0.6660 (9-day simple moving average) – 0.6655 (December 23 low). A break above this range would open the door to further gains, targeting the psychological level of 0.6600.
Consider going long on the Australian dollar today near 0.6680; Stop loss: 0.6670; Target: 0.6730; 0.6740
GBP/USD
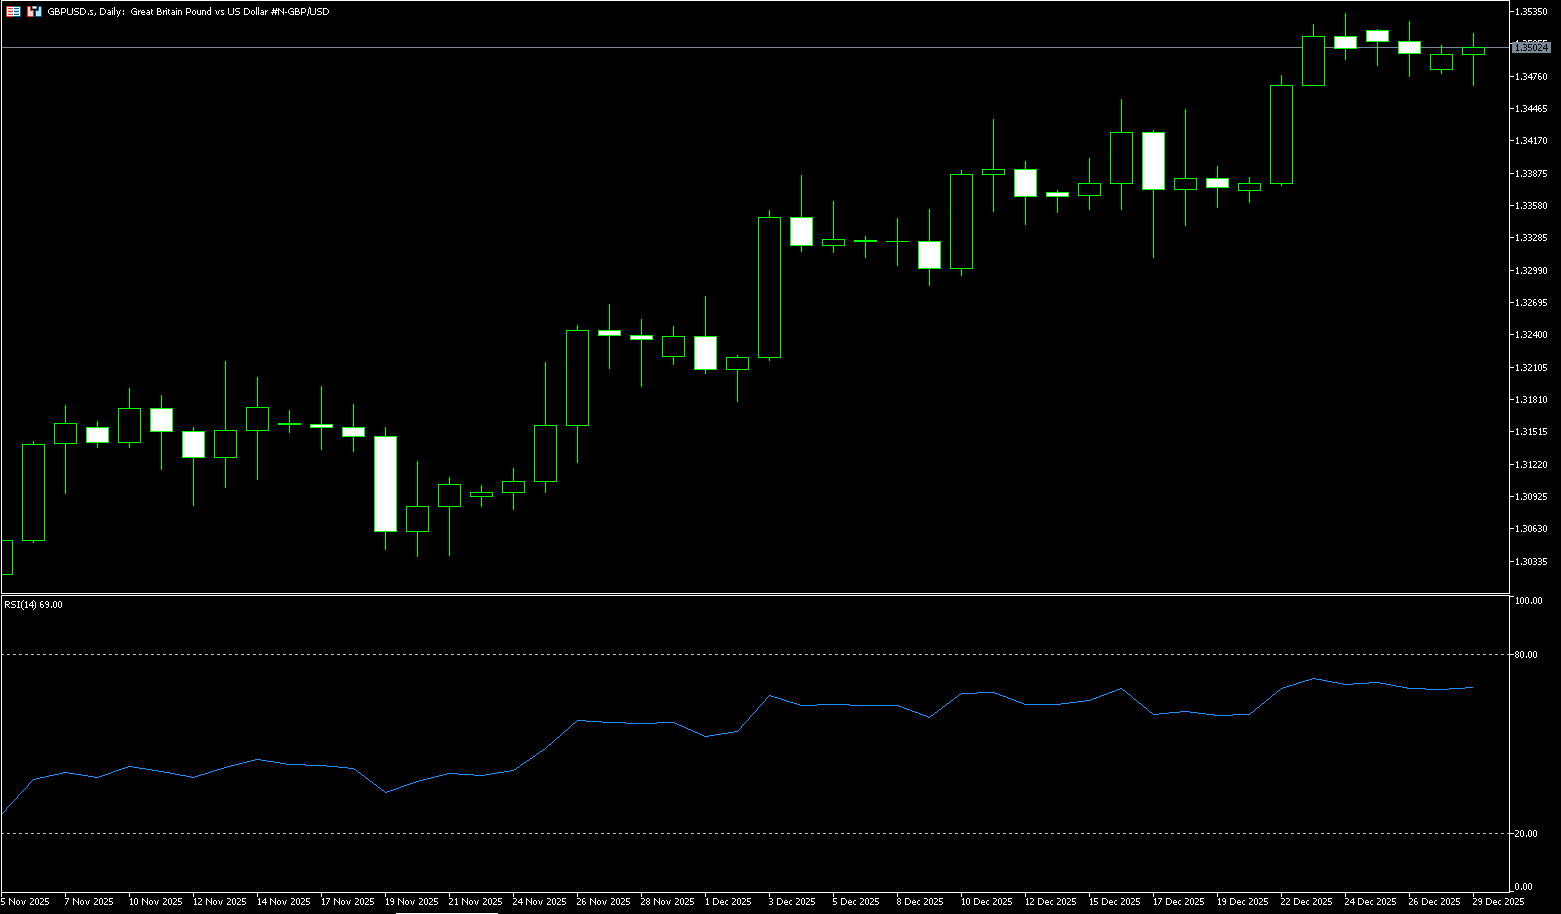
GBP/USD rose after opening lower on Monday, trading around 1.3510. The rise in GBP/USD amid challenges for the dollar may be attributed to increasing market expectations of two more rate cuts by the Federal Reserve in 2026. Traders will likely focus on the release of the minutes from the December Federal Open Market Committee (FOMC) meeting on Tuesday, which could reveal internal policy debates influencing the Fed's outlook for 2026. The Bank of England cut its policy rate by 25 basis points to 3.75% in December, in line with expectations, but the Bank of England expects steady growth in the final quarter. Bank of England Governor Andrew Bailey said he expects interest rates to further. The rate cuts will be gradually reduced, but a warning is issued that there is limited room for further cuts as interest rates approach neutral levels.
On the daily chart, the pound/dollar pair is trading relatively steadily around 1.3500. The 20-day simple moving average is rising at 1.3394, and the price remains above it, reinforcing the upward bias. The recent steep rise in this simple moving average reflects steady buying pressure. Meanwhile, the 14-day Relative Strength Index (RSI) is at 69, indicating a bullish trend with no overbought conditions. The 78.6% Fibonacci retracement level from the high of 1.3726 to the low of 1.3010 acts as resistance at 1.3572. A break above this level could trigger a move towards the psychological level of 1.3600. As for the downside... The first support level is at 1.3452 (61.8% Fibonacci retracement level), followed by the 1.3400 level.
Consider going long on GBP today around 1.3498; Stop loss: 1.3488; Target: 1.3540. 1.3550
USD/JPY
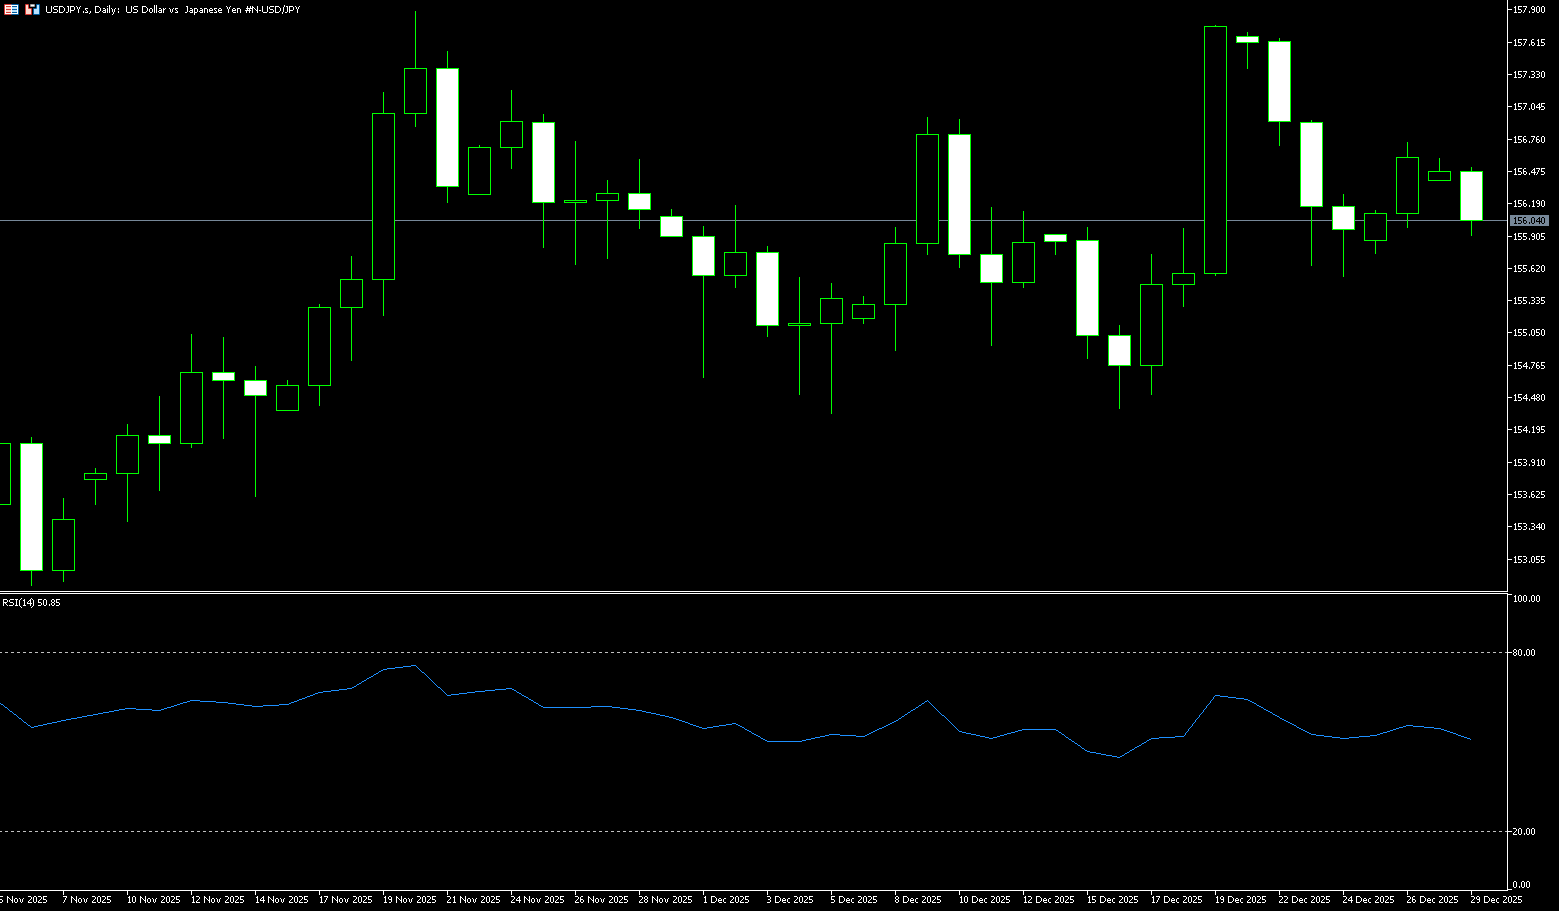
The yen broke through 156 yen per dollar on Monday, recovering some of the losses from the previous session, as investors weighed the timing of further rate hikes against the possibility of intervention in the year-end trading. Focus remains on the policy outlook following the Bank of Japan's December meeting minutes, which showed that policymakers are still debating further tightening even after raising rates to multi-decade highs last month. Some members believe that policy is still far from neutral and favor gradual rate hikes to hedge against inflation risks. Others warned that keeping rates too low helps weaken the yen and push up long-term yields, while timely rate hikes could help anchor inflation expectations and stabilize the bond market, reinforcing expectations of a cautious but sustained normalization path. The market is also watching for signs of government intervention, with Finance Minister Katayama emphasizing the need for further tightening. This gives the exchange government discretion in handling excessive volatility in the yen.
The USD/JPY pair is currently consolidating at higher levels rather than trending in one direction. After rising from its year-to-date lows, the price has repeatedly encountered resistance above 157, with a clear pullback occurring near short-term highs. Meanwhile, support has been found multiple times around 155, indicating that some funds are still willing to maintain dollar exposure due to the relatively favorable interest rate differential. Technically, the chart shows strong resistance around 158, while 155 forms a near-term support zone; further down, the 154.50 level coincides with the medium-term moving average area, representing a "support confluence." Looking at the current structure, the MACD histogram is in slightly negative territory, suggesting that upward momentum has cooled somewhat after the previous surge; the RSI is hovering above 50, reflecting a more balanced power between bulls and bears.
Today, consider shorting the dollar around 156.25; Stop loss: 156.50; Target: 155.40; 155.50
EUR/USD
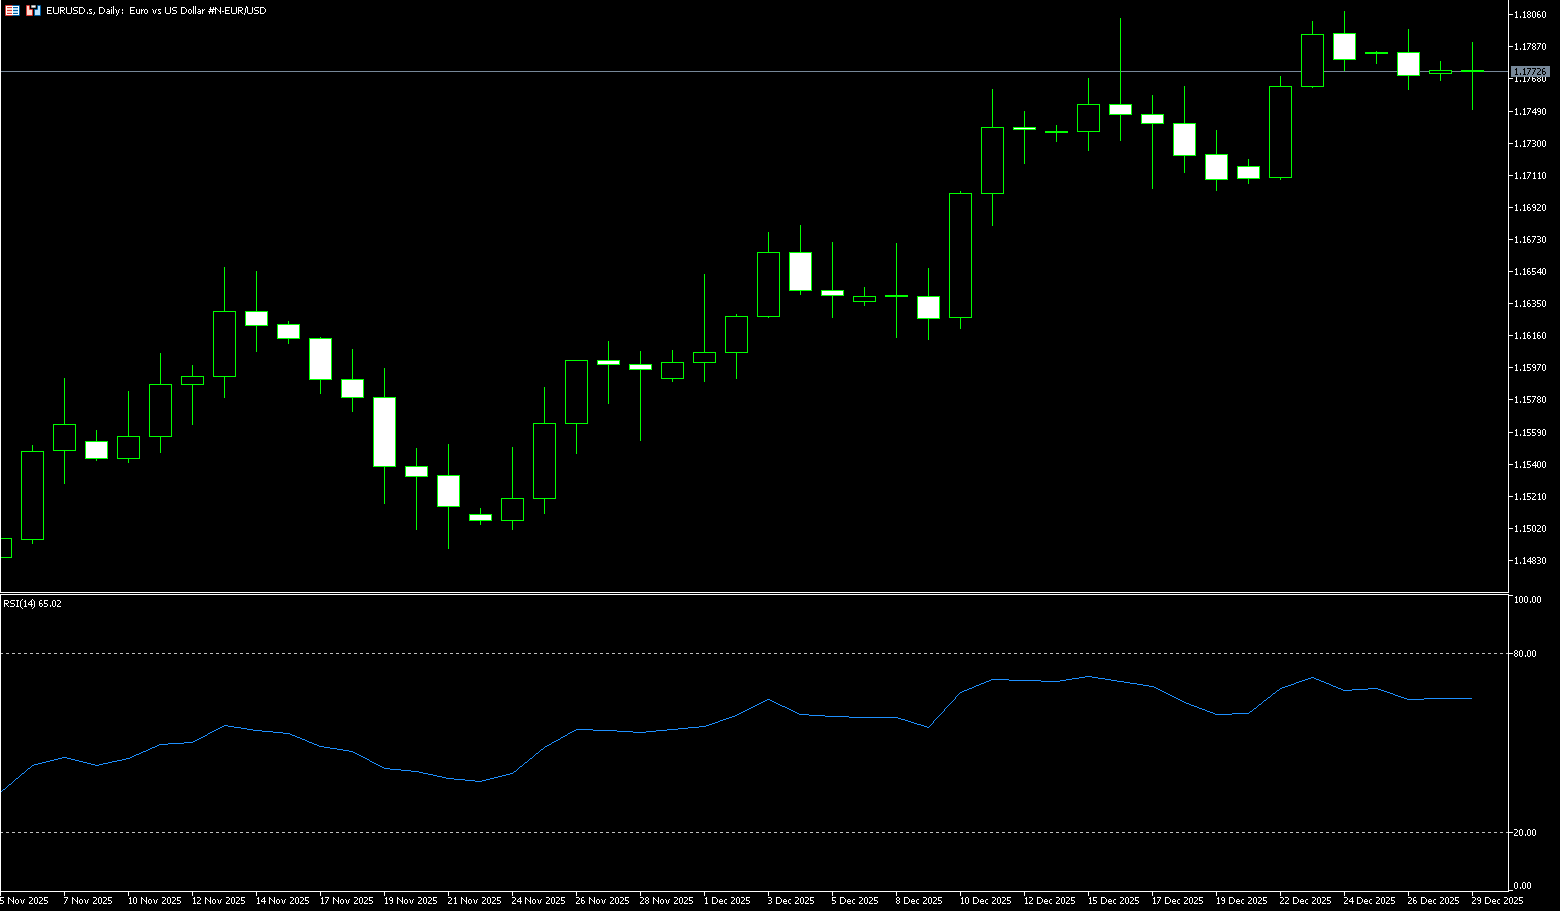
The euro/dollar pair traded in positive territory around 1.1770 in early trading on Monday. The prospect of a Federal Reserve rate cut in 2026 is putting pressure on the dollar against the euro. Markets expect US President Trump to nominate a new Fed chair to replace Jerome Powell, whose term ends in May. Against a backdrop of a cooling labor market and slightly rising inflation, the Fed has cut rates by a cumulative 75 basis points by 2025. Markets also anticipate two additional rate cuts next year, which could weigh on the dollar and create tailwinds for major currency pairs. Across the Atlantic, the European Central Bank (ECB) kept interest rates unchanged earlier this month and indicated it might maintain this level for some time. The currency market expects the ECB to cut rates by 25 basis points in February 2026, with the probability currently remaining below 10%. Signals of the ECB's rate-cutting cycle ending could support the euro in the short term.
The 4-hour chart shows EUR/USD trading around 1.1780 with little intraday movement. The same chart shows the 50-period simple moving average rising above the 100-period and 200-period moving averages, all three trending upwards, and the pair holding above them, maintaining the recent bullish bias. The 50-period simple moving average at 1.1754 provides immediate dynamic support. Meanwhile, technical indicators have lost upward momentum but remain above their midline. The Relative Strength Index (RSI) is at 55. On the daily chart, EUR/USD maintains its positive momentum, keeping buyers in control. The price above the 100-day moving average at 1.1663 and the 50-day simple moving average at 1.1632 provide layered support. Momentum remains above its midline and continues to rise, consistent with buyer dominance. Resistance is at 1.1800 (a psychological level), followed by 1.1808. The recent high was reached on December 16th. The final level was 1.1850, which is the upper boundary of the ascending channel.
Today, consider going long on the Euro around 1.1760; Stop loss: 1.1750; Target: 1.1810; 1.1820
Disclaimer: The information contained herein (1) is proprietary to BCR and/or its content providers; (2) may not be copied or distributed; (3) is not warranted to be accurate, complete or timely; and, (4) does not constitute advice or a recommendation by BCR or its content providers in respect of the investment in financial instruments. Neither BCR or its content providers are responsible for any damages or losses arising from any use of this information. Past performance is no guarantee of future results.
Lebih Liputan


Pendedahan Risiko:Instrumen derivatif diniagakan di luar bursa dengan margin, yang bermakna ia membawa tahap risiko yang tinggi dan terdapat kemungkinan anda boleh kehilangan seluruh pelaburan anda. Produk-produk ini tidak sesuai untuk semua pelabur. Pastikan anda memahami sepenuhnya risiko dan pertimbangkan dengan teliti keadaan kewangan dan pengalaman dagangan anda sebelum berdagang. Cari nasihat kewangan bebas jika perlu sebelum membuka akaun dengan BCR.
BCR Co Pty Ltd (No. Syarikat 1975046) ialah syarikat yang diperbadankan di bawah undang-undang British Virgin Islands, dengan pejabat berdaftar di Trident Chambers, Wickham’s Cay 1, Road Town, Tortola, British Virgin Islands, dan dilesenkan serta dikawal selia oleh Suruhanjaya Perkhidmatan Kewangan British Virgin Islands di bawah Lesen No. SIBA/L/19/1122.
Open Bridge Limited (No. Syarikat 16701394) ialah syarikat yang diperbadankan di bawah Akta Syarikat 2006 dan berdaftar di England dan Wales, dengan alamat berdaftar di Kemp House, 160 City Road, London, City Road, London, England, EC1V 2NX. Entiti ini bertindak semata-mata sebagai pemproses pembayaran dan tidak menyediakan sebarang perkhidmatan perdagangan atau pelaburan.

 English
 简体中文
简体中文
 繁體中文
繁體中文
 Bahasa
Melayu
Bahasa
Melayu
 Tiếng
Việt
Tiếng
Việt
 ไทย
ไทย
 日本語
日本語
 한국어
한국어
 ភាសាខ្មែរ
 español